
Hi. Welcome to Hoory AI!
In this article, we'll dive into the advanced reporting features of your AI assistant. Together we'll go through creating and exporting reports for future analysis and improvement.
Let's get started.
To navigate to the Reports page of your AI assistant:
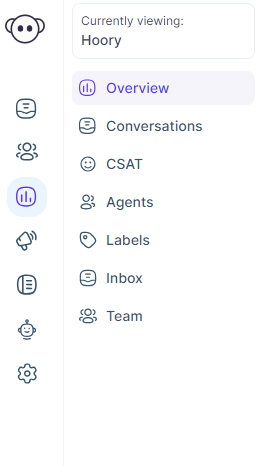
- Select "Reports" from the left sidebar. By default, it will open up the "Reports Overview" page.
Right under the "Overview" section, you'll see six more categories:
- Conversations
- CSAT
- Agent
- Labels
- Channels
- Team
These are the categories based on which you can create reports:
- Ongoing conversations
- CSAT results (Customer Satisfaction Score)
- Agent activities
- Labels
- Channels
- Teams
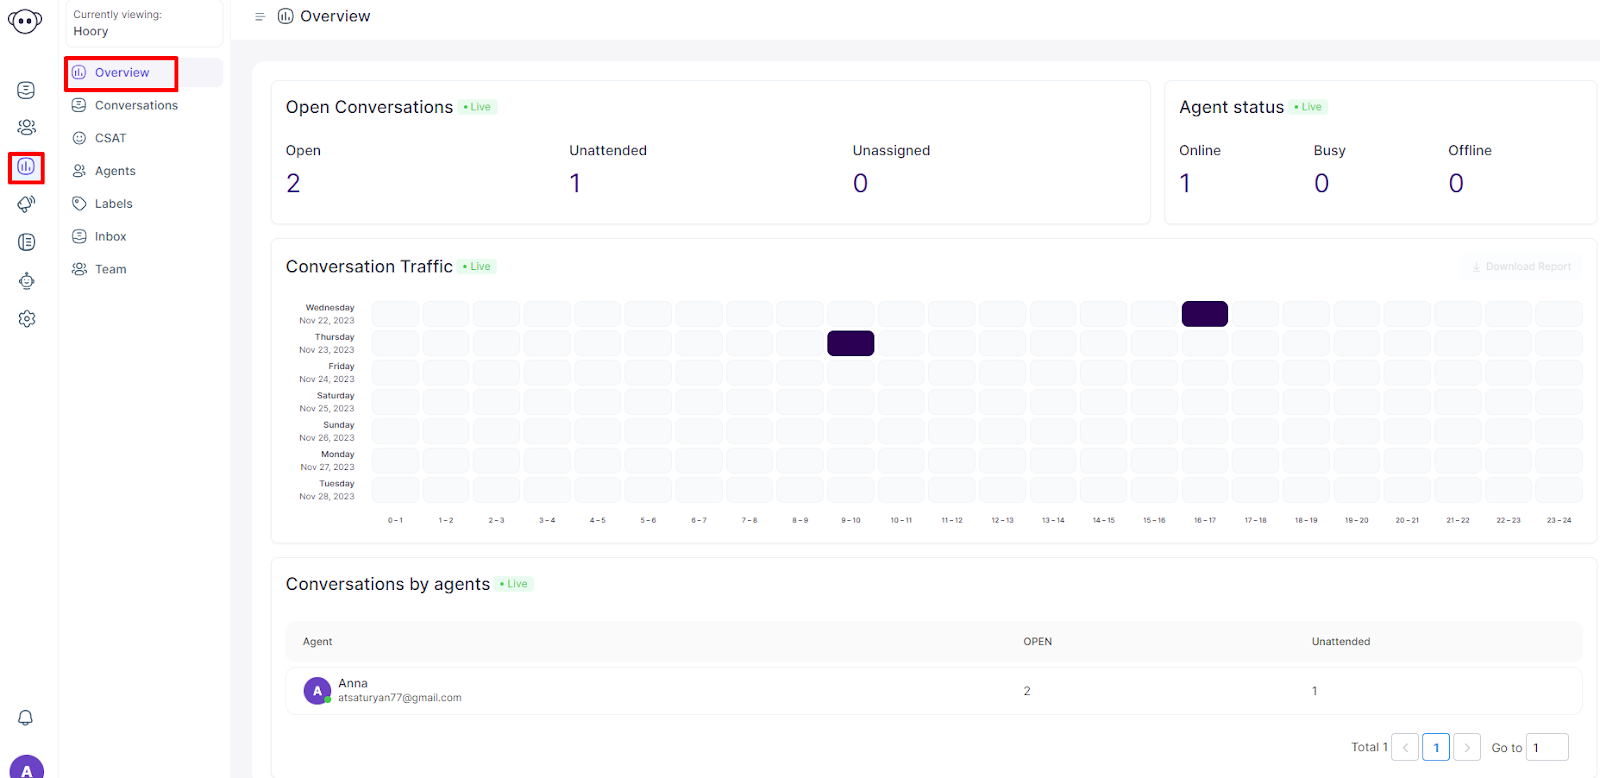
Overview
The Overview page shows the following metrics:
- Open conversations
- Agents status
- Conversations by agents
- Conversations traffic
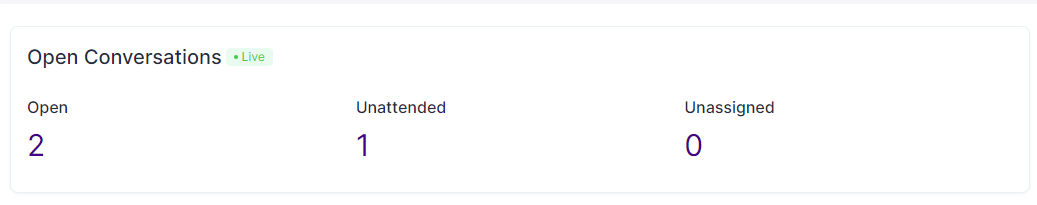
Open Conversations
Open conversations show three types of metrics on the account level.
- Open - total number of open conversations in the account.
- Unattended - total number of unattended conversations in the account.
- Unassigned - total number of unassigned conversations in the account.
Agent Status
Agent Status shows the number of online, busy, or offline agents.

Conversation Traffic
The conversation traffic heatmap shows the times of the day that have been the busiest for the past seven days. Each highlighted cell represents the number of conversations received that day. By hovering over a cell, you will see the exact number of conversations during a specific hour.

Conversations by Agents
It is an agent-level conversation metric. It shows the number of open and unattended conversations for each agent in the account.

Conversations/Agents/Labels/Channels/Teams
To navigate to the desired reporting category:
- Click "Reports" from the left sidebar, then click the desired category name from the list.
The interface is the same for all types of reports, so the following instructions are relevant for all of them.

- Firstly, you can decide the time frame for your report. The report covers the past 7 days by default, but you can also select a custom date range.
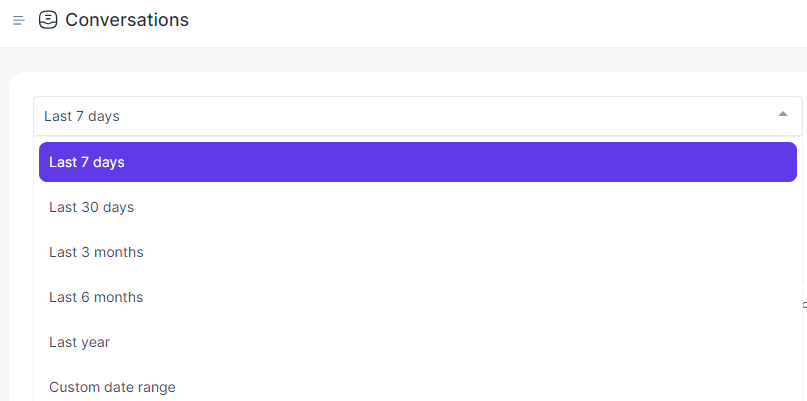
In the screenshot below, you can see the conversation report for the last 30 days, which you can download by clicking the "Download Conversation Report" button at the top right corner. The report will be downloaded in CSV format.

The Conversations page shows the following metrics:
- Conversations
- Incoming messages
- Outgoing messages
- First response time
- Resolution time
- Resolution count
Conversations
Navigate to the Conversations tab from the Reports page, and you will find a graph showing all the conversations that have happened during the selected date range. Upon pointing the mouse to a particular chart, you can see the details of the conversations that happened that day. See a sample graph below.

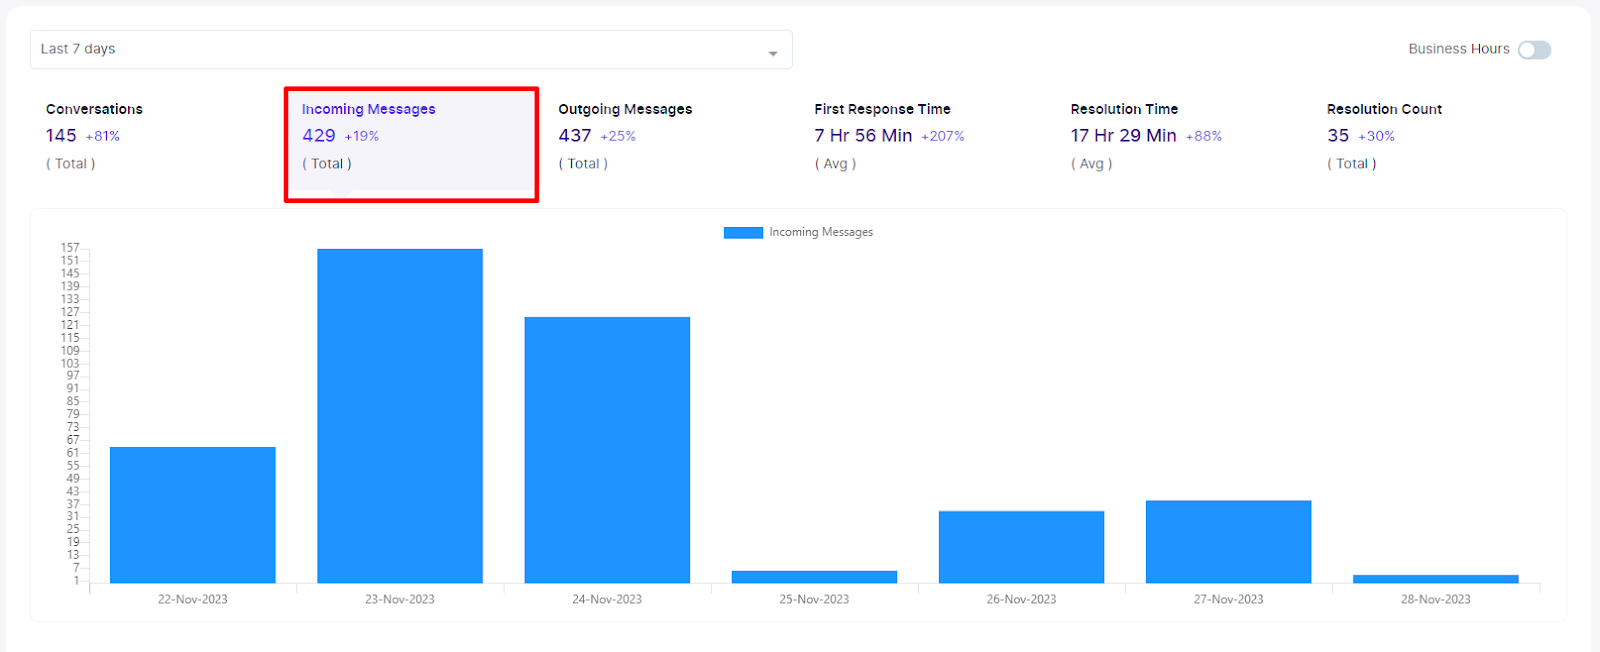
Incoming Messages
Click the Incoming Messages tab in Reports, and you will find a graph showing the number of incoming messages on the selected date range. Upon pointing the mouse to a particular chart, the details of all incoming messages that have happened that day will appear. See the example below.
Outgoing Messages
Click the Outgoing Messages tab from the Reports page, and you will find a graph showing the number of outgoing messages on the selected date range. Upon pointing the mouse to a particular chart, you will see the details of outgoing messages that happened that day. See a sample graph below.

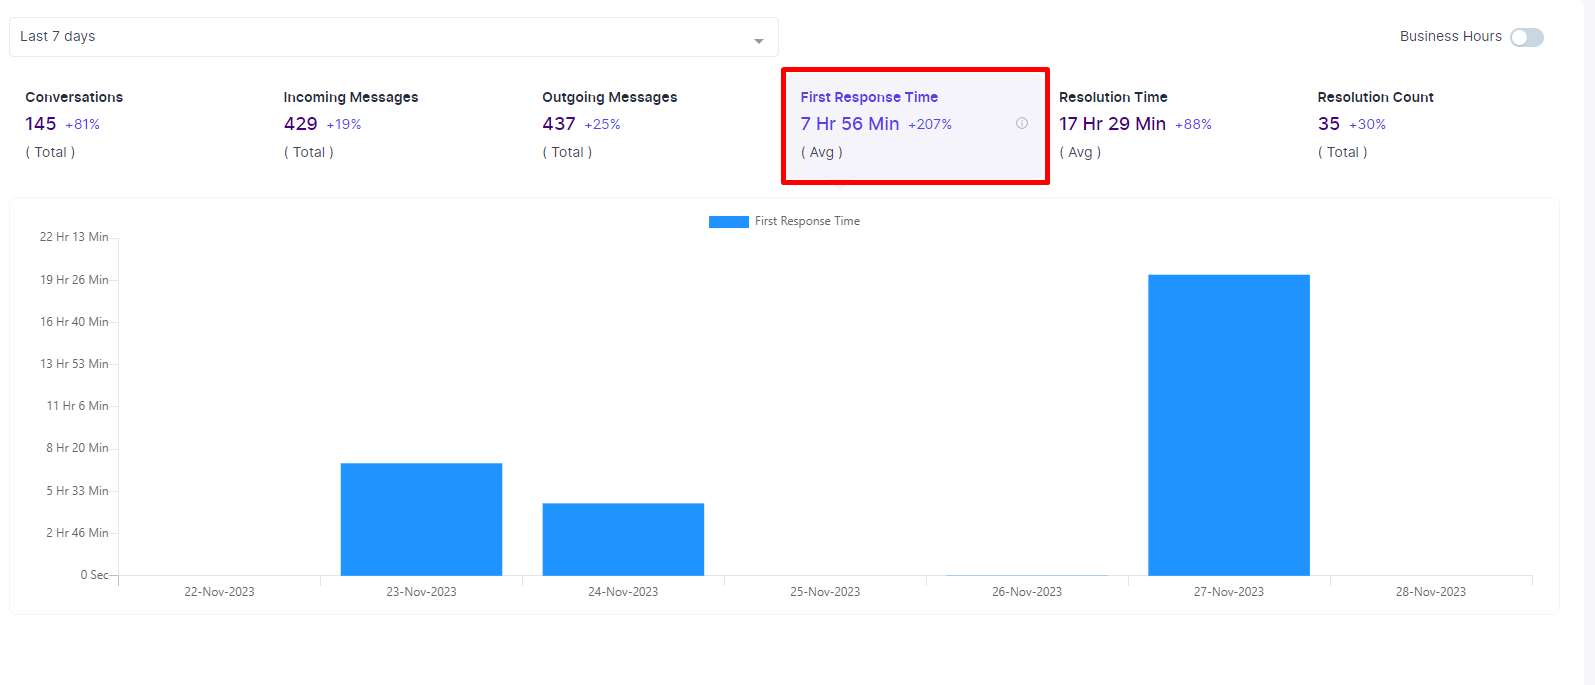
First Response Time
Click the First Response Time tab in Reports, and you will find a graph showing the average time taken to give a first response to a conversation with a customer. Upon pointing the mouse to a particular chart, you can see the average time for the first response and the number of conversations used to calculate the first response for that specific day.
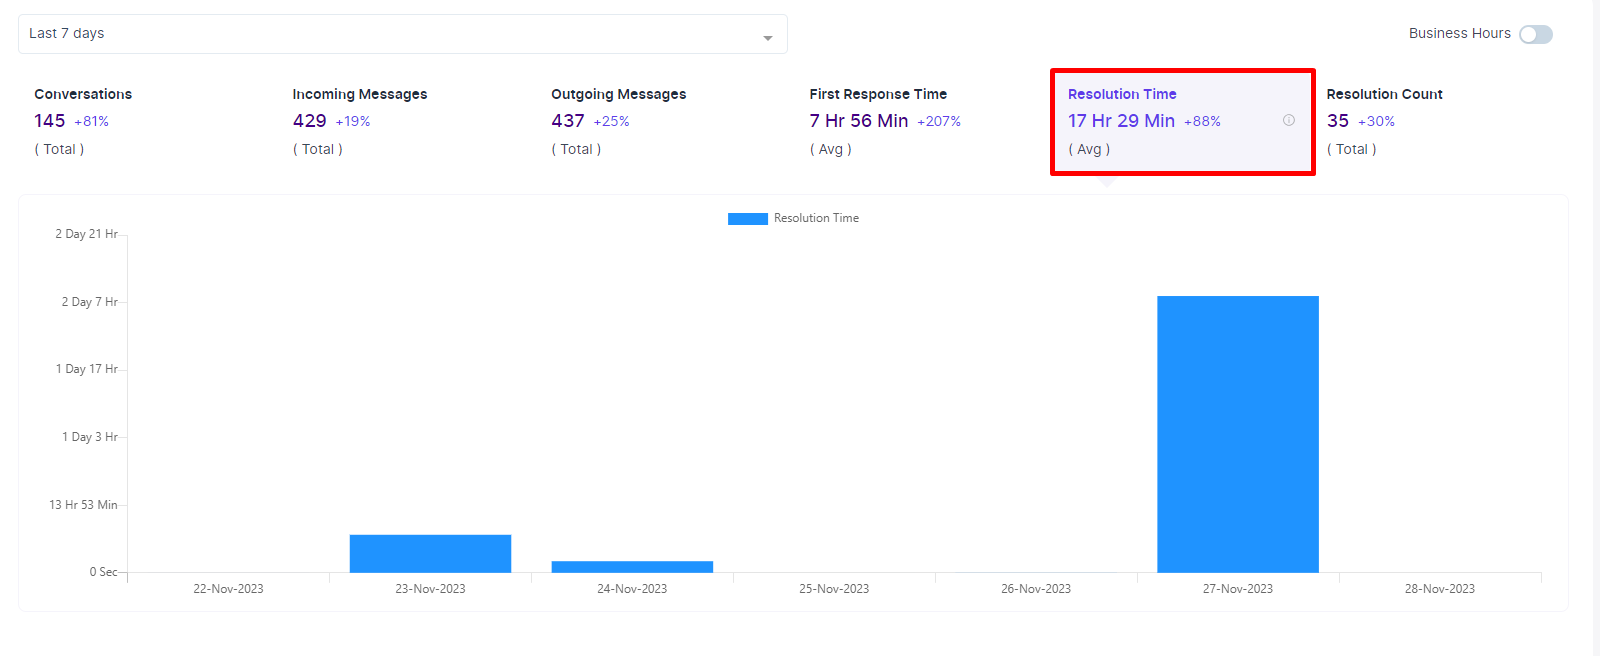
Resolution Time
Click the Resolution Time tab in Reports to find a graph showing the average time to resolve a particular conversation with a customer. Upon pointing the mouse to a specific graph, you will see the average time to resolve conversations and the number of conversations used to calculate the resolution time for that particular day.
Resolution Count
Click the Resolution count tab in Reports, and you will see a graph showing the number of conversations resolved during the selected date range. Upon pointing the mouse to a particular chart, you will see the details of the number of conversations resolved on that day.

Business Hours
Business hours are used to configure the availability of each channel. Report data will be calculated based on business hours if configured.
Go to Channel Settings. Click the Business Hours tab and update the availability.

Switch on the Business Hours toggle to see reports based on them.

Trend
The trend shows the percentage of increase in the metric data. It is displayed on the right side of each metric in the report. The calculation of the trend is given below.

CSAT
To navigate to the "CSAT" page, click "Reports" from the left sidebar, then "CSAT.”
Here you can see the results of all the customer satisfaction surveys collected from customers at the end of each conversation.
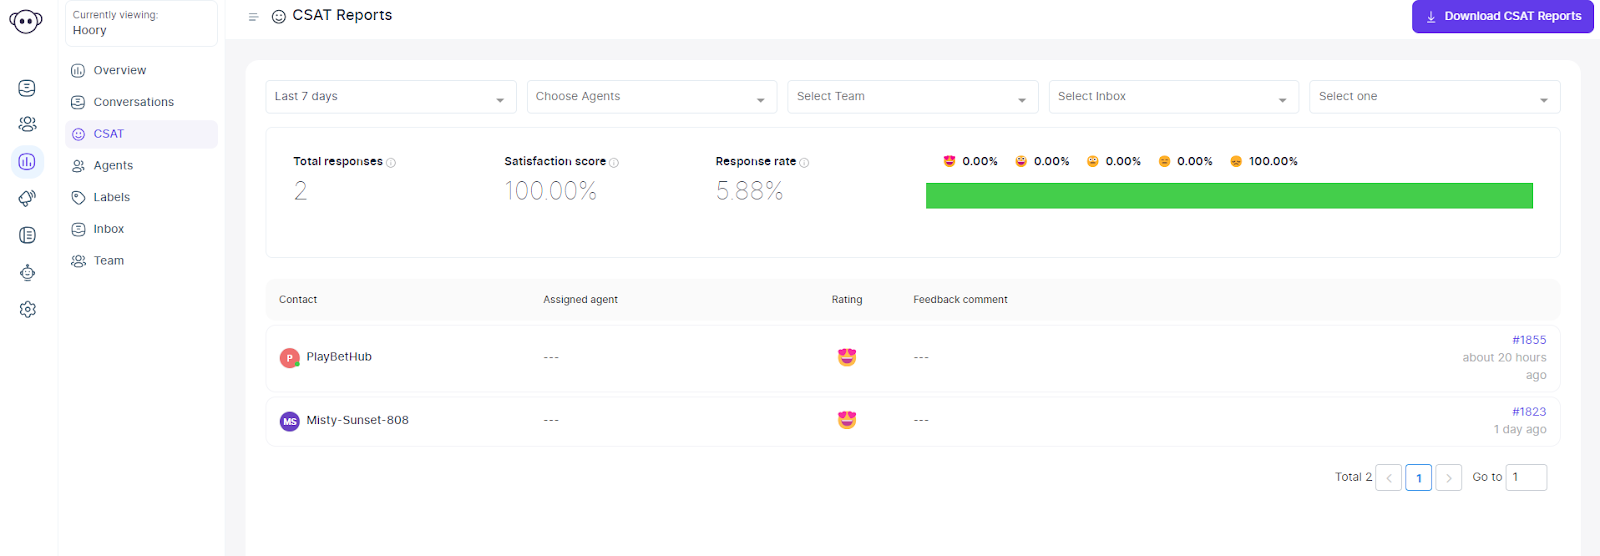
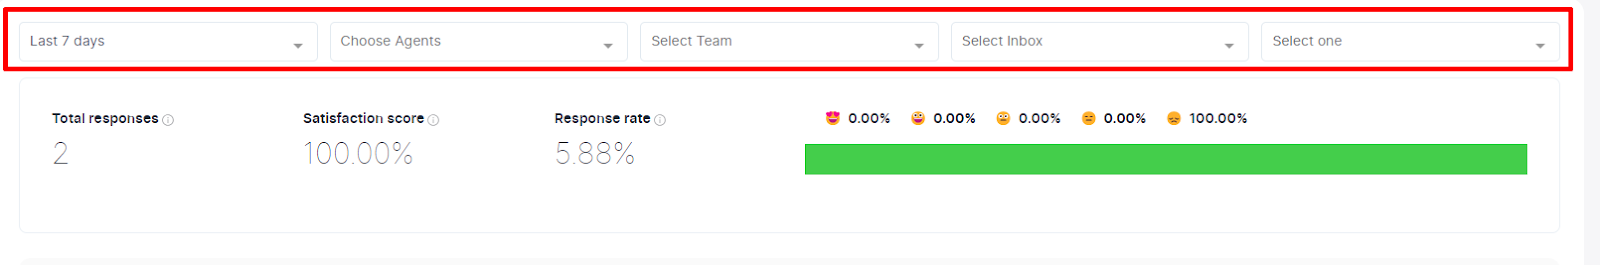
Firstly, you can decide the time frame for your report. The report covers the past 7 days by default, but you can also select a custom date range. The final report can be downloaded by clicking the "Download CSAT Report" button at the top right corner. The report will be downloaded in CSV format.
CSAT can also be filtered by:
- Agent(s)
- Team
- Channel
- Satisfaction score represented by emojis
That's it. Easy as that!
Wrapping up, as you learn the fundamentals, remember there's so much more to explore with Hoory AI. The journey doesn't end here—keep experimenting, learning, and innovating with your AI assistant to unlock its full potential.